
Most of us have an old 1080p monitor collecting dust in a closet or shoved into a corner. Instead of letting it go to waste, I decided to repurpose mine into a dedicated dashboard for my budding home lab. A central hub where I can keep an eye on servers, containers, and network services without cluttering my main workstation. With just a bit of setup and the right software, that forgotten screen transformed into one of the most useful parts of my lab.
Repurposing an old display
One of the tougher things to redeploy in a useful way

It might sound a bit extra, but having a dedicated display for your home lab can be a game changer, especially if you can repurpose an aging monitor. You could just keep a tab open on your workstation, but there are some legitimate advantages to having a dedicated display. It’s cost-effective, always-on, and separates your work space effectively. A resolution of 1080p also gives you enough space and clarity to give your dashboard a polished feel and maintains readability at a bit of distance.
Plenty of dashboards are worth considering
There are a lot of compelling options
Before I settled on my setup, I explored a few popular dashboard tools that work well for self-hosted services. Homepage was chief among them. It’s popular, supports widgets, detailed API integrations, service health monitoring, and even weather and media stats. It’s ideal if you want a more information-dense dashboard and don’t mind a slightly steeper learning curve, but I was looking for something a little simpler to set up. Homarr was another option that took a different approach. It has a modern, drag-and-drop UI that makes organizing your services straightforward.
I went with Glance, a lightweight dashboard powered by a simple YAML configuration file. I can quickly define tiles for services, add status checks, and even integrate external APIs. It’s minimal and fast, lending itself well to modest hardware, and looks great without much tweaking. It can be installed alongside other services using Docker Compose, which I was already using.
Setting up Glance
Incredibly simple
Setting up Glance is a very simple process and really only takes a few minutes to get up and running. I ran it on one of my LXCs on Proxmox inside a Docker container using Compose, but you can run it on just about anything so long as it’s connected to your network. You can spin it up with a simple YAML file, and use the templates available on the Glance GitHub repo to get up and running quickly.
While I don’t have a ton of services I can currently monitor through here, I did experiment with the custom API feature, and connected it to a game server. The Glance YAML configuration file defines rows and cards, where each card can be a service, a link, or a status check. For example, you could make one to check the status of your Proxmox box, make quick links to Plex or Jellyfin, or even integrate a DNS dashboard from Pi-Hole. If there’s an API that spits out JSON, you can pretty much be sure you can integrate it into Glance.
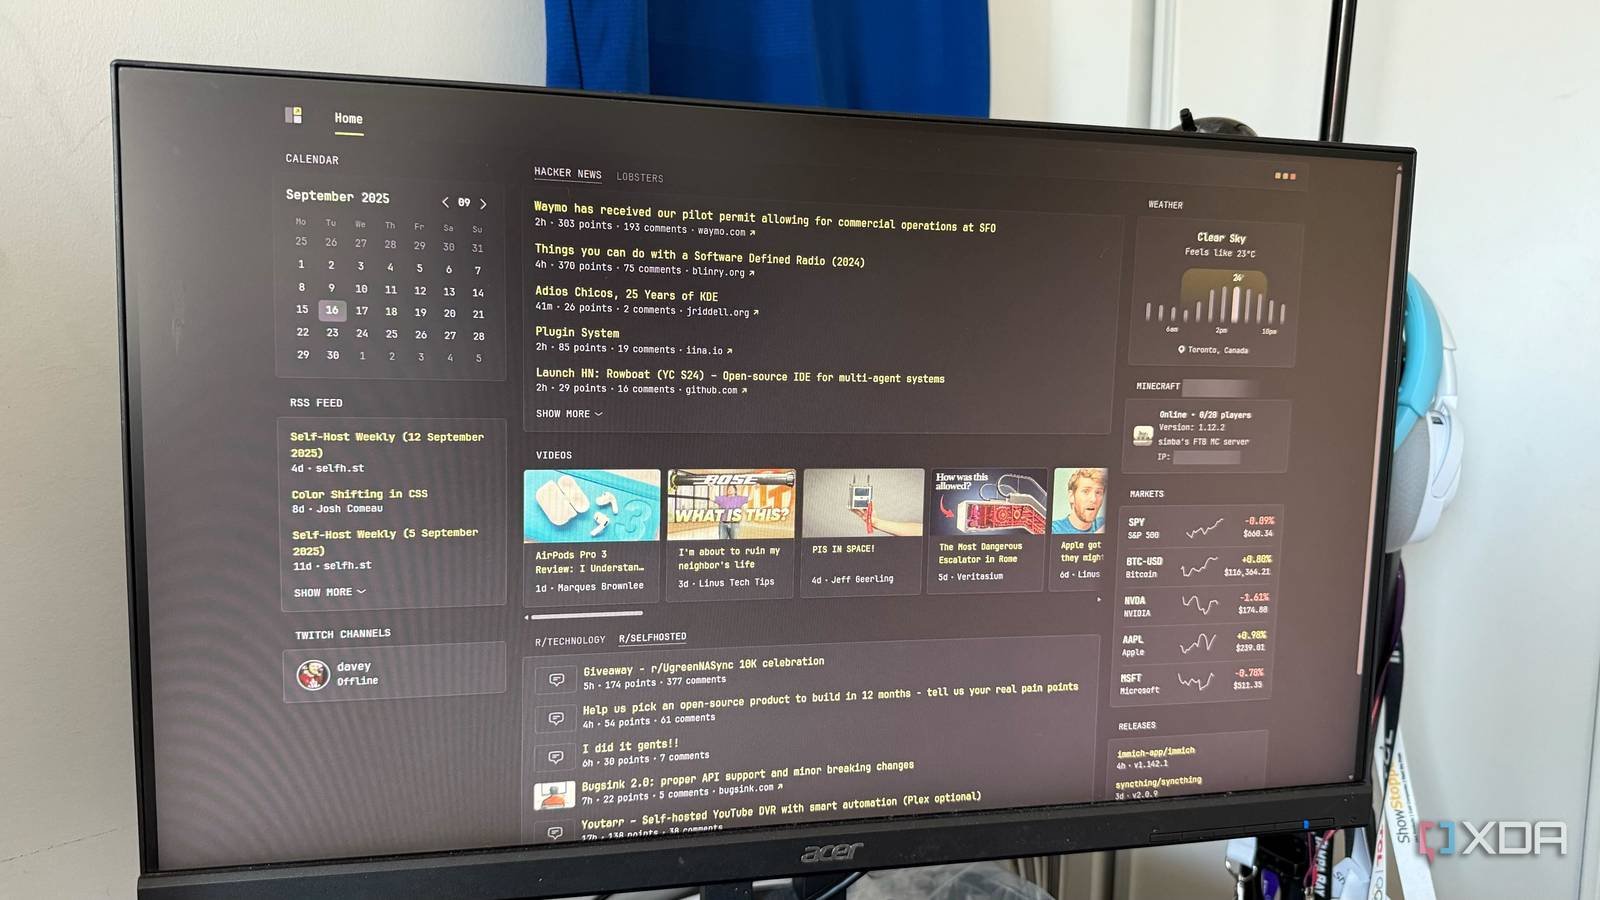
Beyond self-hosted services, Glance also supports many external integrations. This meant I could include things like a weather forecast, a cryptocurrency tracker, or uptime checks on domains I manage. These preconfigured pages are really easy to change; any of the YouTube channels in the “Videos” tab can be changed to your liking, and the same goes for essentially anything else that it pulls from.
A great addition to my modest home lab
What impressed me most about Glance was how good it looked on the screen with very little effort. The default design is clean and minimal, and the fact that it is YAML-based also gave me complete control over how much information I wanted to display. I could make it as barebones as a list of links, or as detailed as a fully interactive hub. Once I add more services to my home lab, I will undoubtedly add them here.
Repurposing an old 1080p monitor into a home lab dashboard turned out to be one of the easiest upgrades I have ever made. With only a small investment of time, I created a clean and always-on display that keeps my services visible without cluttering my main workspace. What started as a forgotten piece of hardware now feels like a professional addition to my lab. If you have unused equipment lying around, this is a simple and rewarding project that can bring it back to life and make your setup far more practical.